


A service business should track roughly eight to twelve KPIs, grouped into four areas: money in, work delivered, clients kept and cash on hand. For most owners that means revenue growth, gross margin, billable utilization, realization, effective hourly rate, days sales outstanding (DSO), client concentration, retention and a forward cash projection. Freelancers need a shorter list. Firms with employees add capacity and project margin. This guide explains each metric, how to calculate it, and how to pick the handful that fit your stage.
TL;DR
- Pick 8 to 12 KPIs at most. Spread them across financial results, delivery, clients and cash so no single number misleads you.
- Utilization alone is not enough. Pair it with realization and effective hourly rate to see whether busy work becomes collected cash.
- Profit and cash are different signals. Track DSO and a forward cash-flow projection next to your income statement.
- Freelancers should start with collected revenue, effective hourly rate, realization, DSO, gross margin and a tax reserve.
- Use benchmarks as context, not targets. Your own trend over 6 to 12 months tells you more.
Table of Contents
- What makes a KPI useful in a service business
- Financial KPIs: revenue, margin and profit
- Delivery KPIs: utilization, realization and rate
- Client and sales KPIs
- Cash KPIs: where profit meets reality
- Which KPIs to track at your stage
- How to build a KPI routine that sticks
- Our perspective: why we start with cash
- Get your KPIs built on clean books
- Common mistakes to avoid
- FAQ
- Sources
What makes a KPI useful in a service business
A service business sells time, expertise and outcomes. There is no inventory to count, so the numbers that matter describe how well you turn capacity into paid work.
A useful KPI passes three tests:
- It changes a decision. If a number moves and you would do nothing differently, stop tracking it.
- You can calculate it from your books. If it needs a separate spreadsheet that nobody updates, it will go stale. Clean bookkeeping is what makes KPIs reliable, which is why we cover how bookkeeping affects business growth in a separate guide.
- It has an owner and a rhythm. Someone reviews it weekly, monthly or quarterly, and the review date is on the calendar.
The four areas below keep the list balanced. Financial metrics tell you what happened. Delivery metrics tell you why. Client metrics tell you what comes next. Cash metrics tell you whether you can afford it.
Financial KPIs: revenue, margin and profit
Revenue growth and collected revenue
Revenue growth compares this period with the same period last year (or last month, for a young business). Formula: (current revenue minus prior revenue) divided by prior revenue.
For a freelancer or a small firm, also track collected revenue: the money that actually reached your bank account in the period. Invoiced revenue can look strong while collected revenue lags by a month or two.
Gross margin
Gross margin is revenue minus the direct cost of delivering the service, divided by revenue. Direct costs include employee or contractor labor on client work, software used only for delivery, and subcontractors. Rent, marketing and your own admin time usually sit below the line.
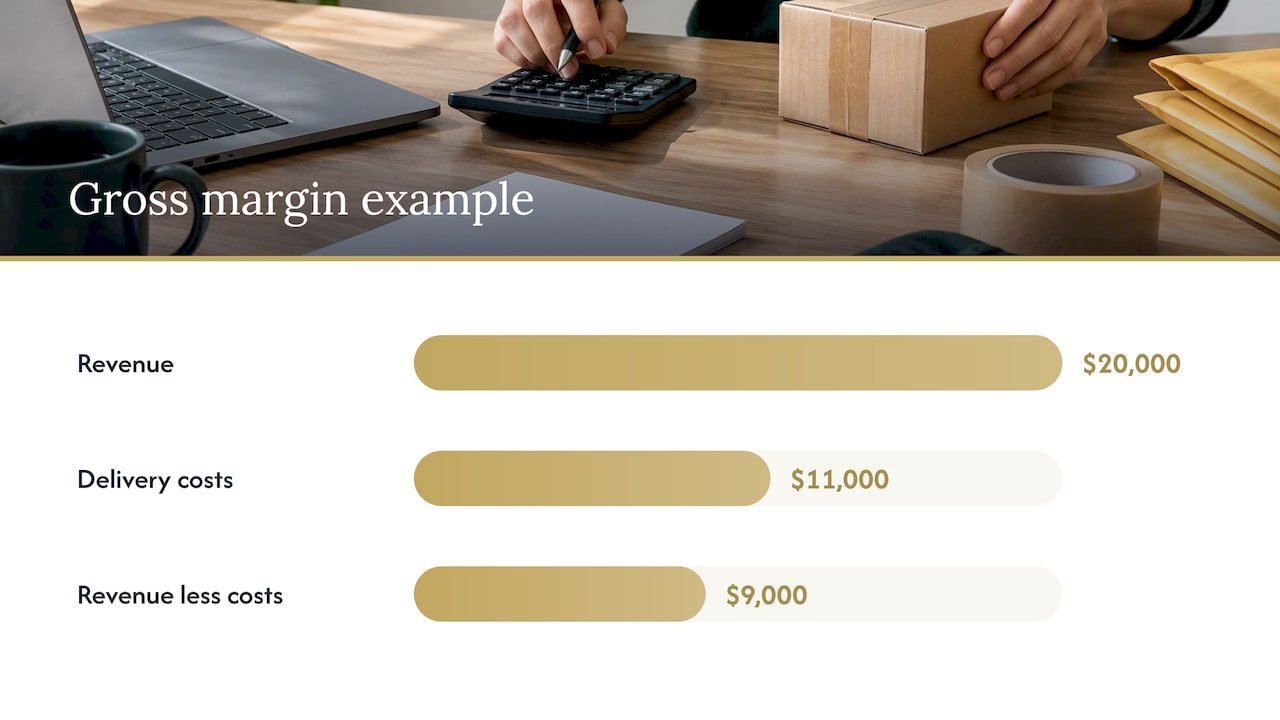
Example: you bill $20,000 in a month and pay $11,000 in delivery labor and subcontractors. Gross margin is $9,000 divided by $20,000, or 45%. If you quote a new project, you can check whether it would land near that number before you accept it.
Project or client margin
Once you serve more than a handful of clients, calculate margin per project or client. Averages hide the client who takes twice the hours the fee assumed. In SPI Research’s 2025 benchmark of professional services firms, average project margin was 35.5% over five years and 35.9% in 2024. Your own number may differ widely by niche, so compare your clients with each other first.
Net profit and EBITDA margin
Net profit shows what remains after all expenses. The same SPI report shows EBITDA margin of 14.9% on a five-year average but 9.8% in 2024, a reminder that margins can move several points in a single year even for established firms.
Delivery KPIs: utilization, realization and rate
These metrics apply most to firms that bill by the hour or track hours against fixed fees: consultants, agencies, bookkeepers, designers, contractors with crews.
Billable utilization
Billable utilization is billable hours divided by available hours. If someone has 160 available hours in a month and bills 112, utilization is 70%. SPI’s 2025 report puts the five-year average employee utilization at 70.8%, with 68.9% in 2024.
Do not push this number to 100%. People need time for sales, training and admin, and a fully booked team has no room for a new client or a rush job.
Realization
Realization compares what you collect with what your standard rates say you should have billed. If your hours at standard rates add up to $10,000 and you collect $8,500 after discounts, write-offs and unbilled overruns, realization is 85%.
A low figure points to scope creep, underpriced fixed fees or unpaid invoices. As Ruddr’s glossary explains for services revenue, the figure depends on hours multiplied by rate or on recognized fixed-fee revenue, so your time tracking has to be consistent for realization to mean anything.
Effective hourly rate
Effective hourly rate is collected revenue divided by all hours worked on the engagement, billable or not. A consultant who quotes $150 an hour but spends extra unbilled hours on revisions and calls may be earning $105. This is the most honest pricing check a solo owner has.
On-time and on-budget delivery
Track the share of projects finished by the promised date and within the hours you budgeted. SPI reports 77.2% of projects delivered on time on the five-year average, down to 73.4% in 2024. Late delivery usually traces back to estimating, not effort, so review how you scope work when this number slips.
Revenue per full-time equivalent
Divide annual revenue by the number of full-time equivalent people. SPI’s 2025 report lists annual revenue per billable consultant of $204,000 on the five-year average and $199,000 in 2024. Treat that as a rough reference for consulting-type firms, not a goal for a landscaping crew or a salon.
Why you read these together
Utilization fell to 68.9% in 2024 in that benchmark while EBITDA also fell and on-time delivery slipped. That pattern is a prompt to look at capacity, pricing, project estimates and delivery quality together, not to chase utilization in isolation. A team can be busy while revenue leaks through discounts, write-offs and unpaid invoices.
Client and sales KPIs
Customer retention and repeat rate
Retention rate is the share of clients at the start of a period who are still clients at the end. If you begin the year with 40 clients and 34 remain, retention is 85%. For recurring services such as bookkeeping, cleaning or maintenance plans, this may be your most important number, because keeping a client costs far less than winning one.
Customer satisfaction and effort
The four main customer-service KPIs are first-contact resolution, customer satisfaction (CSAT), customer effort and response or resolution time. A short survey after each project works for a small business: one rating question and one open comment.
Keep service quality separate from speed. A fast reply that causes rework is not good performance, so pair response time with a quality measure.
Client concentration
Client concentration is the share of revenue from your largest client, or your top three. If one client is 40% of revenue, losing them is a cash emergency. Many owners set an internal ceiling, such as no single client above 25%, and review it quarterly.
The five sales KPIs
For a service business that sells proposals, these five cover the pipeline:
| KPI | What it tells you | Simple formula |
|---|---|---|
| Qualified pipeline value | Potential revenue from real prospects | Sum of open, qualified proposals |
| Pipeline coverage | Whether you have enough opportunities | Pipeline value divided by bookings target |
| Lead-to-proposal conversion | How well you filter and follow up | Proposals sent divided by leads |
| Win rate | How often proposals become clients | Wins divided by proposals decided |
| Sales-cycle length | How long cash is delayed | Average days from first contact to signature |
SPI’s benchmark shows deal pipeline at 166% of the quarterly bookings forecast in 2024 and 168% on the five-year average. Coverage is not revenue. Compare it with your historical win rate: at a 33% win rate you need about three times your target in pipeline.
If online leads feed that pipeline, you will also want to watch your website. This walkthrough on measuring website success with KPIs and tools is a useful starting point for the top of the funnel.
Cash KPIs: where profit meets reality
A business can report a profit and still lack cash for payroll. The Illinois Small Business Development Center’s financial statements guide treats financial statements as tools for diagnosing strengths and weaknesses. Reading the income statement together with the balance sheet is how you catch the gap.
Days sales outstanding (DSO)
DSO is accounts receivable divided by credit sales for the period, multiplied by the number of days in that period. If you have $30,000 outstanding and billed $90,000 over 90 days, DSO is 30 days. If your terms are net 15 and DSO is 45, collections are costing you cash.
When DSO creeps up, a routine fixes it faster than a pep talk. Our 30/60/90 accounts receivable playbook lays out the reminders, and the weekly 5-point aging worklist keeps it from slipping again.
Cash runway and forward projection
The SBA’s guidance on managing your business describes the balance sheet as a snapshot of your finances and ties it to a cash-flow projection for future years. Track two things: cash on hand divided by average monthly expenses (your runway in months), and a 13-week projection of expected receipts and payments. Our step-by-step cash flow forecasting guide shows how to build one.
Tax cash reserve
For freelancers and owners of pass-through businesses, track the amount set aside for taxes against what you expect to owe. Many owners move a fixed percentage of every payment into a separate account. Ask your tax preparer for the percentage that fits your situation, since it depends on entity type, state and income.
Which KPIs to track at your stage
| Stage | Start with | Add later |
|---|---|---|
| Solo freelancer | Collected revenue, effective hourly rate, realization, DSO, gross margin, tax reserve | Client concentration |
| Small team (2 to 10 people) | All of the above plus utilization, project margin, on-time delivery | Retention, pipeline coverage |
| Growing firm | Capacity forecast, revenue per FTE, win rate, retention, EBITDA margin | Forecasted utilization, client profitability ranking |
A simple rule: if you have never tracked anything, begin with four numbers (collected revenue, gross margin, DSO and cash on hand) and add one new KPI every month. Within a quarter you will have a dashboard you trust.
How to build a KPI routine that sticks
- Fix the books first. KPIs are only as good as the transactions behind them. Categories must be consistent and bank accounts reconciled monthly. If you are behind, our guide to catching up on bookkeeping is the place to start.
- Write the definitions down. “Utilization” should mean the same thing in March as in October. Note the formula, the data source and who calculates it.
- Set a weekly and a monthly view. Weekly: cash, open invoices, pipeline. Monthly: margin, utilization, realization, retention.
- Compare with your own history. A trend over 6 to 12 months is more actionable than any industry average.
- Tie KPIs to goals. If you want a 20% margin, the targets for rate, utilization and collections follow from it. See our 10 examples of business financial goals for ideas.
- Review and prune. Each quarter, drop any KPI that did not change a decision.
Our perspective: why we start with cash
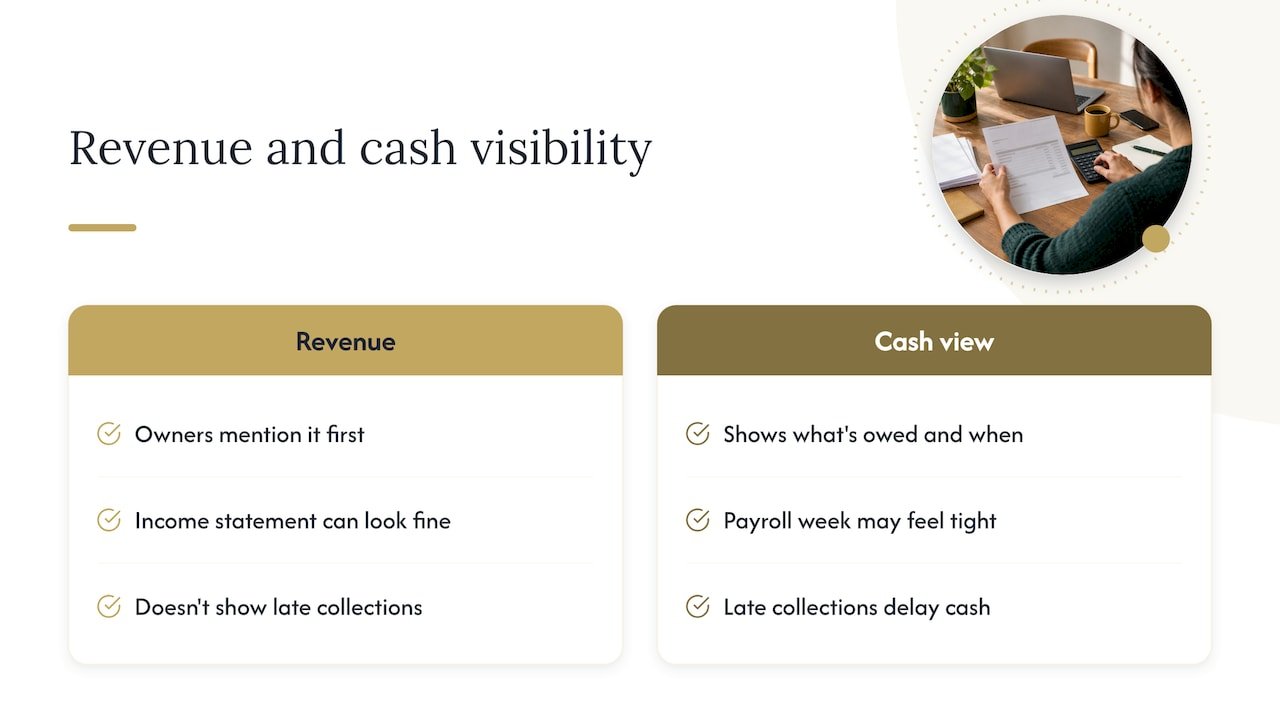
When small business owners come to us worried about their numbers, the metric they mention first is usually revenue. The one they most often lack is a clear view of what is owed to them and when cash will arrive. We start there, because everything else depends on it.
The pattern we see is simple. An owner is busy, invoices are going out, and the income statement looks fine. Yet payroll week feels tight. The explanation is typically late collections, uneven billing or a tax bill nobody set money aside for. None of that shows up in a revenue figure.
So we recommend a short list, built on reconciled books: collected revenue, gross margin, DSO, cash runway and, for teams, utilization paired with realization. We would rather you track five numbers every month than twenty once. If you want to see how the data can guide decisions beyond reporting, read our piece on using financial data for small business growth.
You do not need to do this alone. Our job is to take the accounting burden off your desk so you can read your numbers with confidence and spend your time on clients.
— Kelli
Get your KPIs built on clean books
KelliWorks is a virtual accounting department for small businesses, with virtual and on-site support. We handle bookkeeping, financial consulting, payroll processing, cash flow management and customized reporting, so the numbers in your dashboard match what is in your bank. If you are not sure which KPIs fit your business, book a consultation and we will walk through them with you.
Common mistakes to avoid
- Tracking too many numbers. Twenty metrics means none gets attention.
- Using benchmarks as targets. A consulting benchmark may not fit a trade business or a one-person studio.
- Ignoring write-offs. Unrecorded discounts hide a weak realization rate.
- Reporting revenue without margin. Growth in unprofitable work makes a business bigger and poorer.
- Skipping the balance sheet. Receivables, payables and cash explain what profit cannot.
- Measuring speed without quality. Fast turnaround with rework is not efficiency.
FAQ
What are the top 3 KPIs for a service business?
Most owners get the clearest picture from gross margin, collected revenue and days sales outstanding. Together they show whether work is profitable, whether clients pay, and whether cash arrives on time. Teams that bill hours should add utilization next.
What are the top 5 sales KPIs?
Qualified pipeline value, pipeline coverage, lead-to-proposal conversion rate, win rate and average sales-cycle length. If engagements repeat, add average contract value or recurring revenue. Compare pipeline coverage with your target and historical win rate rather than counting it as revenue.
What are the four main KPIs in customer service?
First-contact resolution, customer satisfaction (CSAT), customer effort and response or resolution time. For a professional service firm, add retention or repeat-purchase rate. Look at quality and speed together.
How often should I review my KPIs?
Review cash, open invoices and pipeline weekly, and margin, utilization, realization and retention monthly. Look at strategic numbers such as client concentration and revenue per employee quarterly. The schedule matters more than the tool you use.
Sources
- 2025 Professional Services Maturity Benchmark, SPI Research
- Glossary of Terms, Ruddr Help
- Manage your business, U.S. Small Business Administration
- Financial Statements, Illinois Small Business Development Center