


Start with a simple template, keep only the accounts you actually use, and number them in blocks with gaps for growth. Most small businesses need somewhere between 20 and 40 accounts total, avoiding overly long charts that make bookkeeping a chore. Copy a proven template into your spreadsheet or accounting software before you record a single transaction, and you’ll avoid the reclassification headaches that plague businesses who build their chart line by line as problems come up.
TL;DR:
- Most small businesses should aim for a chart of 20 to 40 accounts, deleting unnecessary or unused accounts to simplify bookkeeping.
- Use a consistent numbering system with gaps in the 1000 to 5000 range, leaving room for future accounts and avoiding renumbering.
- Build the chart based on your reporting needs, with clear descriptions and proper account categories, avoiding over-complication and duplicate accounts.
- Make structural changes only at period-end, document all updates, and mark inactive rather than deleting accounts that carry balances to preserve report accuracy.
- Outsourcing chart setup to professional services can ensure correct implementation, ongoing maintenance, and a clean, scalable structure tailored to your business.
Table of Contents
- How Do You Set Up a Chart of Accounts?
- What Are the Core Account Groups in a Chart of Accounts?
- Numbering and Coding Best Practices
- How to Build and Import Your Chart Step by Step
- Common Chart of Accounts Mistakes to Avoid
- A Sample Chart of Accounts Template for Small Business
- Keeping Your Chart of Accounts Current Without Breaking It
- When to DIY Your Chart of Accounts and When to Call In Help
- Let Kelliworks Set Up (and Maintain) Your Chart of Accounts
- Sources
- FAQ
How Do You Set Up a Chart of Accounts?
Building a working chart of accounts comes down to four moves, and you can knock them out in an afternoon.
-
Decide your statement scope first. Before naming a single account, know whether you need a basic cash accounting setup or a full accrual structure with inventory and payroll liabilities. Write one clear sentence describing what each account will capture. If you can’t explain an account in one line, you probably don’t need it yet.
-
Pick a numbering convention and leave gaps. Number in tens (1010, 1020, 1030) rather than sequentially (1, 2, 3). This is a small habit, but leaving numeric gaps prevents renumbering later when you add a new bank account or expense line mid-year.
-
Trim the template aggressively. Standard templates come loaded with accounts for scenarios you’ll never hit. Delete what you don’t need, then add only the revenue splits you’ll actually pull into reports, whether that’s separating product sales from service income or tracking two sales channels.
-
Import before your first transaction. Load the finished chart into QuickBooks, Xero, or your spreadsheet, then run three or four test entries. Check that they land on the right line of your income statement or balance sheet before you trust the system with real bookkeeping.
That sequence takes most owners under two hours, and it saves months of cleanup down the line.
What Are the Core Account Groups in a Chart of Accounts?
A chart of accounts organizes every account in your general ledger into five groups, and each group maps directly to one of your two core financial statements. Get this structure right and your reports build themselves. Get it wrong and you’ll be reclassifying transactions for years.
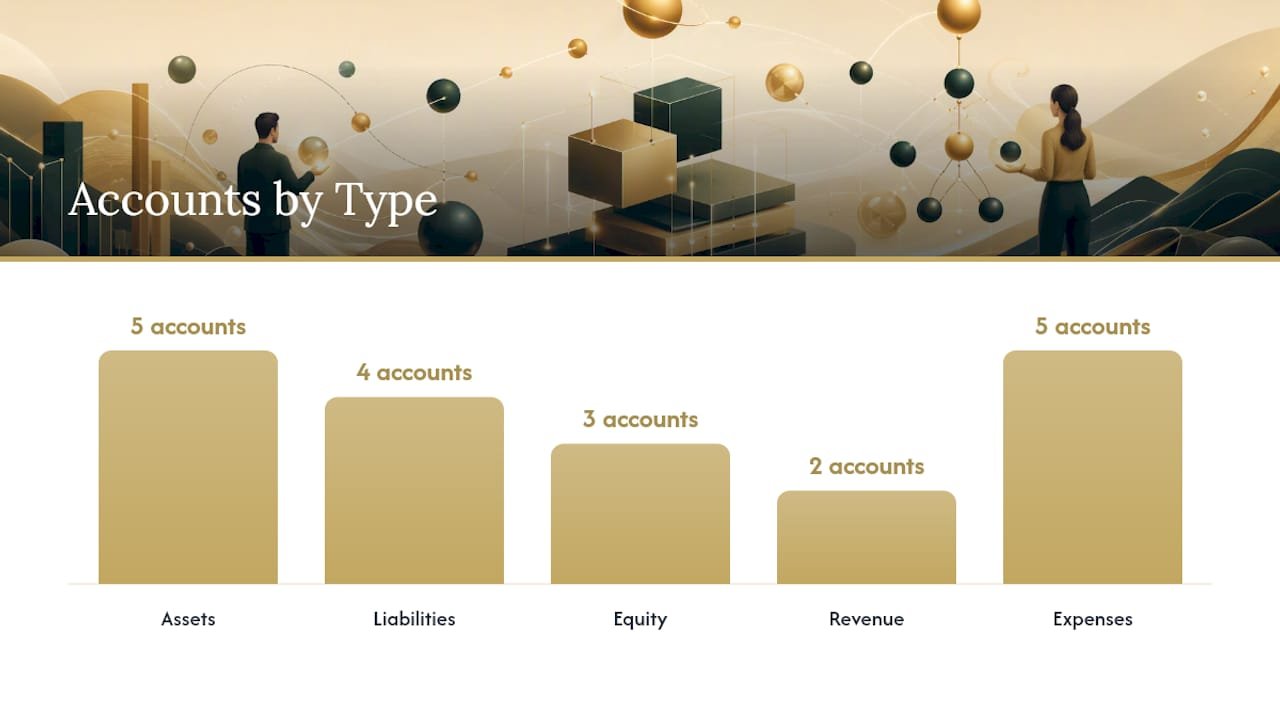
Assets are what your business owns. A typical small-business list includes:
- Checking and savings accounts
- Accounts receivable
- Prepaid expenses (insurance, rent)
- Equipment and vehicles
- Accumulated depreciation
Liabilities are what your business owes:
- Accounts payable
- Credit card balances
- Payroll liabilities (withheld taxes, unpaid wages)
- Loans payable
- Sales tax payable
Equity tracks the owner’s stake:
- Owner’s contributions
- Owner’s draws or distributions
- Retained earnings
Revenue (or income) captures what you earn:
- Primary sales or service revenue
- Secondary revenue streams (if material enough to track separately)
- Interest income
Expenses cover what it costs to run things:
- Cost of goods sold (materials, direct labor)
- Rent and utilities
- Payroll expense
- Software subscriptions
- Professional fees
Assets, liabilities, and equity flow into your balance sheet, a snapshot of what you own and owe on a given date. Revenue and expenses flow into your income statement, which shows performance over a period. This mapping isn’t optional structure. It’s how accounting software generates your reports automatically, and it’s part of why the Financial Accounting Standards Board expects consistent classification across reporting periods.
Subaccounts earn their place when a parent account gets too broad to be useful. If “Office Expenses” is hiding $8,000 in software costs and $200 in supplies, split it. But resist creating a subaccount for every vendor. A general ledger account should represent a category you’ll analyze, not a running list of every check you’ve written.
Numbering and Coding Best Practices
A consistent numeric code turns your chart of accounts into something your bookkeeper, your CPA, and your software can all read the same way. The standard block convention most small businesses follow looks like this:
- 1000 to 1999: Assets
- 2000 to 2999: Liabilities
- 3000 to 3999: Equity
- 4000 to 4999: Revenue
- 5000 and up: Expenses
This isn’t a rigid law. Numbering conventions vary somewhat by firm and industry, but the block logic holds up almost everywhere because it lets anyone scan an account number and instantly know what statement it belongs to.
Within each block, number in tens rather than consecutively. Your checking account might be 1010, savings 1020, accounts receivable 1030. That leaves room to insert a second checking account at 1015 without renumbering everything that follows it. Renumbering an active chart mid year is one of the more disruptive mistakes a growing business can make, because it breaks comparability with prior reports.
How many digits you need depends on your size. A solo freelancer can run comfortably on four digits. A business with multiple locations, product lines, or departments often needs five, with the extra digit reserved for a department or division code. Don’t jump to five digits just because it looks more professional. Extra digits you’re not using just add friction every time someone codes a transaction.
Pro Tip: If you expect to add a second location or business line within the next two years, build that dimension into your numbering now, even with a placeholder. Adding a department code later means touching every existing transaction; building it in from day one means changing nothing.
When you do need to track a dimension like department or product line, resist the urge to create a full duplicate set of accounts for each one. A single “Rent Expense” account with a department tag or class field (a feature most accounting software includes) does the job without doubling your account count. This is the difference between a chart with 30 accounts and one with 150 accounts that all say roughly the same thing.
How to Build and Import Your Chart Step by Step
Here’s the exact workflow to take a blank template to a working chart of accounts your software recognizes.
1. Set up your template columns. Whether you’re working in a spreadsheet or your accounting software’s import screen, you need six columns: account number, account name, account type (asset, liability, equity, revenue, expense), which financial statement line it feeds, a one-line description, and a tax mapping note if the account affects a specific tax form line. Software vendors document these exact import fields because mismatched columns are the most common cause of import errors.
2. Start from a template, not a blank page. Customizing a shipped template down to size produces fewer errors than building a chart from scratch, because the template already reflects standard statement mapping. QuickBooks, Xero, and most bookkeeping platforms ship with an industry-appropriate starting chart.
3. Remove what you won’t use. Go line by line and delete accounts that don’t apply to your business. A service business doesn’t need inventory accounts. A retail business does. Be honest about what you’ll actually report on rather than keeping accounts “just in case.”
4. Add the revenue and expense lines you actually need. This is where the template gets personal. If you run two distinct service lines and your CPA wants to see them separately at tax time, add two revenue accounts. If not, one is fine. Write a one-line description for every account you add so the next person who touches your books (including future you) knows exactly what belongs there.
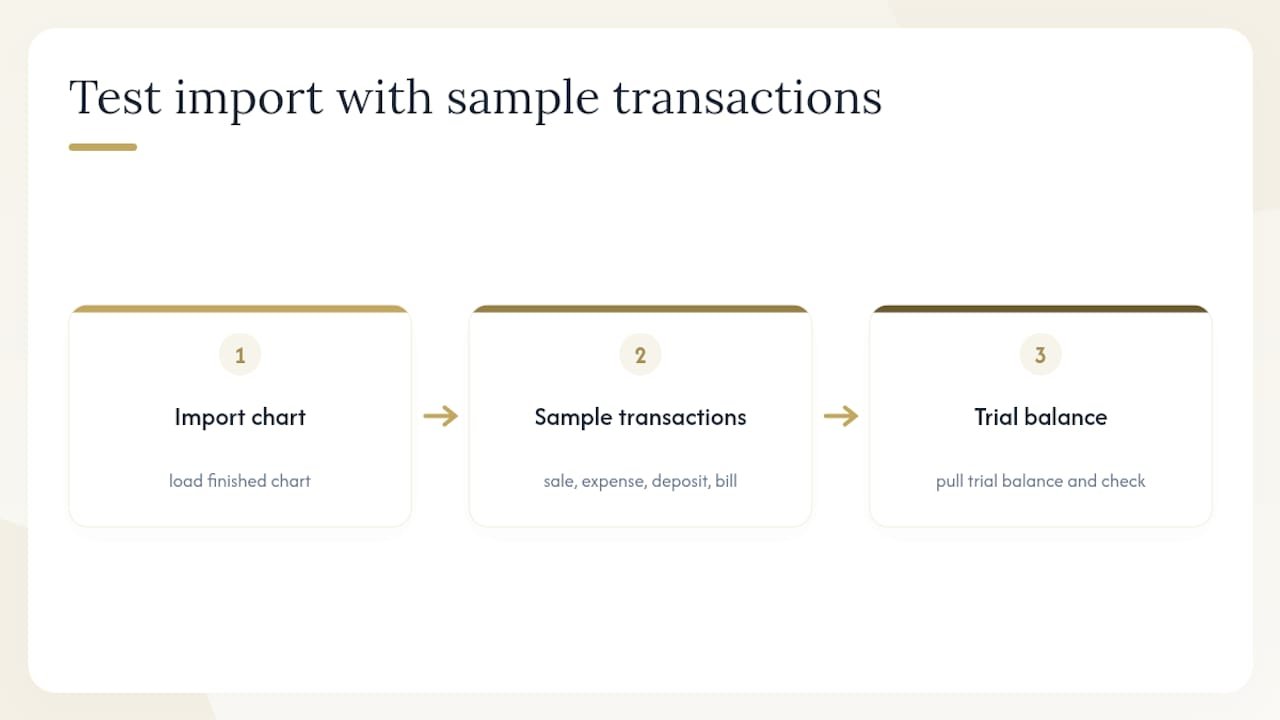
5. Import and test before going live. Load the finished chart into your software of choice. Our guide to QuickBooks setup for growing businesses walks through the import screen in more detail if that’s your platform. Once it’s loaded, enter three or four sample transactions covering a sale, an expense, a bank deposit, and a bill payment. Pull a trial balance and check that everything landed where you expected.
6. Set unused defaults to inactive. Most software ships with dozens of default accounts you’ll never touch. Rather than deleting them (which can break historical reports if they were ever used), mark them inactive so they disappear from dropdown menus without disturbing anything.
7. If you’re changing an existing chart, wait for period-end. Never restructure an active chart of accounts mid-month or mid-quarter. Structural changes belong at period-ends, and any balance you need to move between accounts should go through a documented journal entry, not a direct edit. This preserves your ability to compare this quarter to last quarter without an asterisk.
That’s the whole process. It reads like more steps than it is: most owners finish steps one through four in under an hour once they’ve picked a template.
Common Chart of Accounts Mistakes to Avoid
Most chart of accounts problems trace back to a handful of avoidable habits.
- Too many accounts. Most small businesses function fine with 20 to 40 accounts total. If you’re staring down a 150-line chart, ask whether each split actually changes a decision you make. If it doesn’t inform pricing, budgeting, or tax prep, merge it.
- Vague account names with no description. “Miscellaneous Expense” or “Other Income” invites every ambiguous transaction to pile up in one place, and six months later nobody remembers what half of it was for. Write a one-line rule for every account: what goes in it, what doesn’t.
- Renaming or deleting active accounts mid year. This breaks historical comparability and can corrupt reports that reference the old account. Mark it inactive instead, and make the change at period-end.
- Overusing “miscellaneous.” A catch-all account is fine for genuinely rare, immaterial items. If more than a few percent of your transactions land there, you need a real category.
- Skipping descriptions entirely. A short note on each account, matching the general ledger documentation practices many accounting departments follow, keeps categorization consistent even as you add staff or hand off bookkeeping.
Our bookkeeping best practices guide covers naming conventions in more depth if you want to build this discipline into your broader books, not just the chart itself.
A Sample Chart of Accounts Template for Small Business
A workable small-business chart of accounts sample rarely needs more than 30 to 35 lines. Here’s a compact structure built around the standard numbering blocks.
| Account Number | Account Name | Type |
|---|---|---|
| 1010 | Checking Account | Asset |
| 1020 | Savings Account | Asset |
| 1030 | Accounts Receivable | Asset |
| 1010 | Prepaid Expenses | Asset |
| 1020 | Equipment | Asset |
| 2000 to 2999 | Accounts Payable | Liability |
| 2000 to 2999 | Credit Card Payable | Liability |
| 2000 to 2999 | Payroll Liabilities | Liability |
| 2000 to 2999 | Sales Tax Payable | Liability |
| 3000 to 3999 | Owner’s Contributions | Equity |
| 3000 to 3999 | Owner’s Draws | Equity |
| 3000 to 3999 | Retained Earnings | Equity |
| 4000 to 4999 | Service Revenue | Revenue |
| 4000 to 4999 | Product Sales | Revenue |
| 5000 and up | Cost of Goods Sold | Expense |
| 5000 and up | Payroll Expense | Expense |
| 5000 and up | Rent Expense | Expense |
| 5000 and up | Software Subscriptions | Expense |
| 5000 and up | Professional Fees | Expense |
Notice the tens spacing within each block. That’s deliberate room to insert a second checking account at 1015 or a new revenue stream at 4015 without disturbing anything else.
Freelancers and solo consultants can trim this down further, often to 20 accounts or fewer, by collapsing revenue into a single line and skipping accounts like inventory or COGS entirely if they don’t sell physical goods. Product businesses with multiple SKUs or sales channels expand the opposite direction, adding revenue accounts by channel (retail, wholesale, online) and possibly separate COGS lines to track margin by product line. The template scales in both directions; the discipline of one-line descriptions and gap numbering stays the same either way.
Keeping Your Chart of Accounts Current Without Breaking It
A chart of accounts isn’t a set-it-and-forget-it document, but it also isn’t something to tinker with weekly. The rule that keeps both instincts in check: make structural changes only at period-end, whether that’s month-end, quarter-end, or year-end, and document every change.
When you do need to change something, record the date, the reason, and who approved it. This sounds like overkill for a two-person business, but it saves real time when your CPA asks a year later why an account structure shifted mid year.
Never delete an account that has ever carried a balance or a transaction. Mark it inactive instead. If you need to move an existing balance into a new or different account, use a dated journal entry rather than editing the account directly. This keeps your historical reports intact and auditable.
Build in an annual review, ideally right before tax season, and involve whoever touches your books regularly:
- Your bookkeeper flags accounts that have gone unused all year
- Your CPA flags anything that would make tax prep cleaner if split out or combined
- You, as the owner, confirm the revenue and expense splits still match how you think about the business
That fifteen-minute conversation once a year keeps your chart useful instead of letting it drift into the same 150-line clutter you were trying to avoid in the first place. Our bookkeeping cycle guide has more detail on where this review fits into your broader monthly and annual close process.
When to DIY Your Chart of Accounts and When to Call In Help
We’ve built charts of accounts for small businesses across a wide range of industries, and the pain points repeat themselves. Owners either over-engineer the chart with dozens of near-duplicate accounts, or they under-build it and end up with a “Miscellaneous” category swallowing a third of their transactions by year three. Both problems are fixable, but both cost real time to unwind once they’re baked into a year of history.
A simple template works fine for a sole proprietor with one revenue stream and no employees. The math changes once you add payroll, multiple revenue lines that need separate reporting, inventory, or plans to bring on investors who’ll want clean historical financials. At that point, the setup decisions you make now determine how much your CPA charges you at tax time for years to come.
A standard chart of accounts setup engagement typically starts with scoping reporting needs, moves through building and importing the chart into software, runs a quality check against sample transactions, and ends with a short training handoff so teams know how to code new transactions correctly from day one.
— Kelli
Let Kelliworks Set Up (and Maintain) Your Chart of Accounts
If you’d rather skip the trial-and-error of building this yourself, professional virtual accounting services can handle chart of accounts setup as part of a broader virtual accounting engagement, not a one-time favor you’re billed for and left to figure out alone. They build your chart to match your actual reporting and tax needs, import it into QuickBooks or your platform of choice, and keep it clean as your business grows.

A typical engagement includes customizing a template to your industry and revenue structure, handling the QuickBooks import and testing, documenting every account with a clear description, and a short training handoff so your team knows exactly where new transactions belong. From there, our virtual accounting department keeps your books, payroll, and tax prep running on the same clean structure month after month, so you’re not paying to untangle a messy chart later. If you’re deciding whether this is worth outsourcing versus handling in-house, our breakdown of why small businesses hire a virtual accountant walks through the trade-offs. Ready to get your books built right the first time? Visit our accounting services page to start a conversation about your setup.
Sources
A few sources are worth bookmarking if you want to go deeper on any piece of this. The Financial Accounting Standards Board sets the GAAP framework your chart should ultimately support, particularly once your business grows past the simplest cash-basis setup. Investopedia’s chart of accounts entry is a solid plain-English reference for the core definitions if you need to double-check a term with a bookkeeper or partner. Microsoft’s Business Central documentation on setting up and changing charts of accounts is useful even if you don’t use that specific software, since the import field logic mirrors most modern accounting platforms. And for a ready-to-use starting point, the copy-paste chart of accounts template referenced earlier in this guide gives you a working file rather than just a concept. If you’re evaluating accounting software options before you commit to an import, this comparison of accounting software platforms covers several tools worth considering for compatibility with a standard chart import.
- Chart of Accounts (COA): Definition, How It Works, and Example
- Chart of Accounts: Definition, Best Practices, and Examples | NetSuite
- Set up or change the chart of accounts – Business Central | Microsoft Learn
- Chart of Accounts: Copy-Paste Template
FAQ
How do you set up a chart of accounts?
Start from a standard template, assign account numbers in blocks (1000s for assets, 2000s for liabilities, and so on), delete accounts you won’t use, and import the finished chart into your accounting software before recording transactions.
What are the 5 basic categories in a chart of accounts?
The five core categories are assets, liabilities, equity, revenue, and expenses, with assets, liabilities, and equity feeding the balance sheet and revenue and expenses feeding the income statement.
How should a chart of accounts be structured?
Structure it in numbered blocks by account type, typically 1000 to 1999 for assets, 2000 to 2999 for liabilities, 3000 to 3999 for equity, 4000 to 4999 for revenue, and 5000 and up for expenses, numbering in tens to leave room for future accounts.
What are the most common chart of accounts mistakes?
The most frequent mistakes are creating too many near-duplicate accounts, using vague names like “Miscellaneous” without a one-line rule, and restructuring active accounts mid-period instead of waiting for period-end and documenting the change.
How many accounts should a small business chart have?
Most small businesses run well with 20 to 40 accounts total. If your chart has grown well past that without a clear reporting reason for each split, it’s worth a trim, something a Kelliworks setup engagement handles as part of the initial build.