


A 13-week cash flow is a rolling, weekly projection of cash receipts and disbursements that gives finance leaders a one-quarter view of liquidity without the noise of accrual accounting. Its value sits in three outputs you should check every week: the minimum cash week, projected ending cash, and weeks of runway. If any of those three numbers surprises you, your forecast needs attention before your bank balance does.
TL;DR:
- A 13-week cash flow forecast is a rolling weekly projection that emphasizes actual data, focusing on the minimum cash, projected end cash, and weeks of runway.
- Building the forecast requires current AR and AP data sourced from the underlying ledgers, with a clear focus on accuracy in the first four weeks.
- Weekly updates should follow a fixed schedule with reconciliations of bank balances, AR, and AP, supported by a change log for transparency and variance analysis.
- Scenario testing involves three versions of assumptions—base, downside, and severe—to prioritize cash management strategies and mitigate liquidity risks.
- A forecast’s value depends on leadership actively using it in decision-making, integrating it into approvals for hires, contracts, and capital expenditures.
Table of Contents
- What a 13-week forecast is and why it matters
- Structure and core inputs: building on a single source of truth
- How to build a 13-week forecast: a step-by-step workflow
- Templates and examples: when Excel works and when to automate
- Weekly maintenance and governance: who owns what, and when
- Scenario planning and stress testing: running fast what ifs
- How to analyze and report the outputs that matter
- Common mistakes and a compact weekly checklist
- How we support small businesses running weekly forecasts
- Why the 13-week forecast deserves a seat at the leadership table
- Get help building and running your weekly cash flow forecast
- FAQ
What a 13-week forecast is and why it matters
The model works on a rolling window: each week you drop the week that just closed and add a new Week 13 to the far end, so you always have a full quarter of forward visibility instead of a shrinking one. That structure is what separates a 13-week cash flow from a one-time projection, and it’s why we treat it as an operating habit rather than a document you pull out during a crisis.
CFOs, lenders, and private equity sponsors rely on this cadence because weekly granularity catches timing problems that monthly forecasts miss entirely, and it supports covenant monitoring where a single missed payment can trigger a default clause.
Businesses typically adopt the discipline when:
- Cash is tight and the margin for error has shrunk
- Revenue is seasonal and liquidity swings sharply within the year
- A lender or investor requires weekly or biweekly reporting as a loan covenant
Structure and core inputs: building on a single source of truth
A reliable model follows a predictable layout. Most practitioners build a summary tab, a weekly cash waterfall, AR and AP roll-forwards, a payroll schedule, and a debt schedule, each feeding into the same weekly grid. That structure keeps every assumption traceable back to its origin instead of buried in a single tab of guesses.
The rule that keeps the model trustworthy is one source of truth per line item:
- Accounts receivable comes from the AR subledger, not a sales forecast
- Accounts payable comes from the AP aging report, tied to actual due dates
- Cash balances come from the bank, reconciled daily or weekly
- Payroll comes from the HRIS or payroll provider’s run schedule
Granularity is a judgment call. Customer-level detail for your five largest accounts reduces error in the near weeks, where it matters most, while smaller customers and vendors can be aggregated by category without much loss of accuracy. The goal is precision where the dollars are concentrated and simplicity everywhere else. Our guide to cash flow forecasting for small businesses walks through how to set up these data feeds so they stay current rather than going stale after week one.
How to build a 13-week forecast: a step-by-step workflow
Building a decision-grade model takes a structured sequence, not a single afternoon of spreadsheet work.
- Set a look-back window. Pull three to six months of actual cash activity to establish patterns in collections, disbursements, and payroll timing.
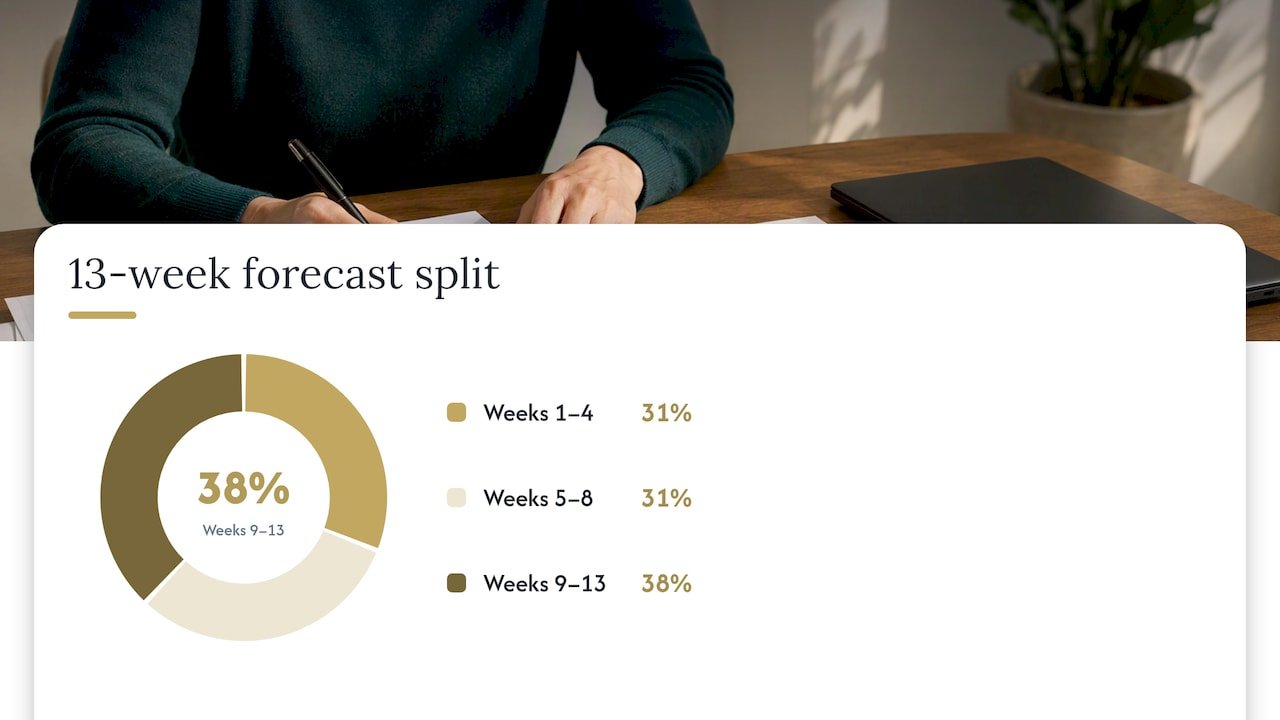
- Set accuracy targets by horizon. Weeks 1 through 4 should be built from known invoices and scheduled payments. Weeks 5 through 8 rely on recent trends. Weeks 9 through 13 are directional and get refined as they move closer.
- Map open AR to expected collection weeks based on customer payment history, not invoice terms alone.
- Schedule AP by actual due date, not by when you’d prefer to pay, so the cash impact is honest.
- Treat payroll and debt service as fixed and certain. These rarely move, so they anchor the rest of the model.
- Document every assumption in a visible tab: collection lag by customer segment, payment terms assumed, and any one-time items.
- Set a weekly deadline, assign an owner for each line item, and start a change log that records what shifted and why.
Pro Tip: Lock your Week 1 and Week 2 numbers to actual bank and AR data before you touch anything further out: a forecast that’s wrong in the near term is far more dangerous than one that’s imprecise in week 11.
Bookkeeping that stays current is what makes steps one through four possible in the first place. Our breakdown of managing cash flow through consistent bookkeeping covers how clean AR and AP data shortens the build process considerably.
Templates and examples: when Excel works and when to automate
A solid Excel template should include the same tabs described above, linked so that a change in the AR roll-forward flows automatically into the weekly waterfall and the summary tab. Good templates also build in input validation, so a typo doesn’t silently break a formula three tabs away, plus a dedicated assumptions tab that keeps judgment calls separate from hard data.
Free 13-week cash flow templates are widely available and commonly used as a starting point in restructuring and turnaround work, which makes them a reasonable first step for a business building its first model.
Signs it’s time to move beyond a spreadsheet:
- You’re consolidating cash positions across multiple entities or bank accounts
- Your data sources have multiplied beyond what one person can reconcile weekly
- You’re running scenario versions often enough that manual rebuilding eats a full day each week
Weekly maintenance and governance: who owns what, and when
The forecast only holds value if someone updates it on a fixed schedule and someone else reviews it. A workable weekly rhythm looks like this:
- Monday: Pull actual bank balances and reconcile against last week’s forecast
- Tuesday: Update AR based on new invoices and any collections received
- Wednesday: Update AP with new bills and confirm upcoming payment dates
- Thursday: Refresh the sales or pipeline assumptions feeding weeks 9 through 13
- Friday: Finalize variance commentary and distribute the updated forecast
Reconciling Week 1 actuals against the prior week’s forecast is the single most useful variance check you can run. When actual collections lag the forecast by a meaningful margin, update the collection-lag assumption for that customer segment rather than letting the gap repeat silently.
Pro Tip: Keep a running change log next to the model itself, not in a separate email thread: when a stakeholder asks why Week 6 moved, you want the answer in one place.
A documented variance routine is also what builds credibility with lenders and investors who see the forecast on a recurring basis.
Scenario planning and stress testing: running fast what ifs
A useful scenario set doesn’t require rebuilding the model three times. It requires three versions of a small number of inputs.
- Base case: your current assumptions, unchanged.
- Downside case: collections slip one to two weeks, and one or two discretionary expenses are added back in.
- Severe case: a major customer payment is delayed, revenue drops materially, and you model the effect of drawing on a line of credit or short-term borrowing, including any covenant thresholds that borrowing might approach.
Once you can see all three side by side, use them to prioritize real levers: stretching AP terms with flexible vendors, delaying non-essential capital spending, or accelerating collections on your largest outstanding invoices. Our guide to scenario financial planning for finance teams covers how to structure these versions without duplicating your entire model each time.
How to analyze and report the outputs that matter
The forecast generates dozens of numbers, but only a handful drive decisions. Track these every week:
- Minimum cash week: the single lowest projected balance across the 13-week window
- Ending cash: the balance at the close of Week 13
- Weeks of runway: how many weeks remain before cash would go negative at current trends
- Variance to forecast: how far last week’s actuals diverged from what you projected
A one-page weekly snapshot works better than a full model dump for executive or lender audiences. Lead with the headline metrics, add one or two sentences explaining the biggest variance driver, and close with a recommended action. The Financial Industry Regulatory Authority and similar bodies emphasize this kind of disciplined liquidity oversight for regulated institutions, and the same logic scales down to a small business watching its own runway.
Sample language that works in a weekly update: “Minimum cash week falls in Week 7 at a tighter margin than planned, driven by a delayed customer payment. Recommend holding discretionary spend until collection confirms.”
Common mistakes and a compact weekly checklist
The same errors show up across most forecasts that drift from reality.
- Pulling data from multiple, inconsistent sources instead of one system of record per line item
- Leaving assumptions static for months instead of updating them as actuals come in
- Updating the model late in the week, after decisions have already been made
- Ignoring early warning signs like slipping collections or an unexpected payable
| Weekly checklist item | Why it matters |
|---|---|
| Reconcile bank balance to forecast | Confirms Week 1 accuracy before trusting later weeks |
| Update AR from subledger | Prevents stale collection assumptions |
| Confirm AP due dates | Avoids surprise cash outflows |
| Log any assumption changes | Keeps variance explainable to stakeholders |
| Flag covenant or minimum-cash risk | Surfaces problems while there’s time to act |
How we support small businesses running weekly forecasts
Building and maintaining a 13-week forecast takes consistent bookkeeping, current AR and AP data, and someone accountable for the weekly update. We handle those pieces: bookkeeping, accounts receivable and payable management, payroll processing, and financial forecasting, all built on a single set of books so your forecast isn’t guessing at numbers from three different systems. That single source of truth is what keeps a weekly forecast from drifting within a month.
Why the 13-week forecast deserves a seat at the leadership table
We think the biggest mistake leadership teams make is treating the 13-week forecast as a finance department deliverable instead of a decision tool. A forecast nobody reads in the weekly leadership meeting isn’t doing its job, no matter how carefully it’s built.
Bring the minimum cash week and runway number into every approval conversation, whether that’s a hire, a vendor contract, or a capital purchase. The discipline only pays off when it actually changes what you decide to do next.
— Kelli
Get help building and running your weekly cash flow forecast
If building a 13-week forecast feels like one more thing competing for your attention, we handle the full cycle for you: bookkeeping that stays current, AR and AP management, payroll processing, and the weekly forecasting and reporting that turns raw numbers into a usable decision tool.

Our full-service accounting and bookkeeping services are built around exactly this kind of weekly discipline, so your forecast reflects real bank activity rather than last month’s guesswork. If you’re weighing whether to bring in outside support, our rundown of signs your business needs financial consulting can help you decide. When you’re ready to talk through your specific situation, schedule a consultation and we’ll walk through what a working 13-week forecast would look like for your business.
FAQ
What is a 13-week cash flow chart?
A 13-week cash flow chart is a weekly projection of cash receipts and disbursements covering roughly one fiscal quarter, usually displayed as a grid with line items like AR collections, AP payments, payroll, and debt service running across 13 weekly columns. It’s used to spot the specific week where cash runs tightest, often called the minimum cash week.
What does rolling 13 weeks mean?
A rolling 13-week forecast always covers the same length of time: each week you remove the week that just ended and add a new week at the far end, so the horizon never shrinks. This keeps a constant one-quarter view of liquidity rather than a forecast that counts down to zero.
What is the 13-week cash budget?
A 13-week cash budget is another name for the same tool: a weekly plan of expected cash inflows and outflows over a 13-week horizon, used to identify funding gaps before they happen. It differs from a monthly budget mainly in its granularity, which catches short-term timing issues that monthly numbers smooth over.
What is a 12-month rolling cash flow?
A rolling cash flow applies the same rolling-window logic over a full year instead of 13 weeks, typically at monthly granularity rather than weekly. It’s better suited to longer-term planning and budgeting, while the 13-week version is built specifically for near-term liquidity management.