


Financial statements are your business’s operating dashboard: they show where money is, where it went, and what decisions those flows require. According to the SEC, there are four core statements every manager should know: the balance sheet, the income statement, the statement of cash flows, and the statement of shareholders’ equity. Together, they support performance measurement, liquidity management, and day-to-day decision-making. OpenStax frames accounting as the “language of business” — and mastering these four documents is a leadership skill, not just a compliance task.
Two quick actions you can take right now:
- Pull last month’s cash flow statement and compare operating cash flow to net income. If they diverge significantly, you have a working capital issue to investigate.
- Add three ratios to your next monthly report: current ratio, gross margin, and accounts receivable (A/R) days. Those three alone will tell you more than a page of narrative.
Table of Contents
- How financial statements work in your business
- How managers actually use financial statements day-to-day
- How to analyze financial statements: techniques and ratios that matter
- Reading the statements together: what the combined signals mean
- Your monthly and quarterly financial review checklist
- Common mistakes and red flags to watch for
- When to bring in an accountant or financial consultant
- Key Takeaways
- What most managers get wrong about financial statements
- Kelliworks: your virtual accounting department for financial clarity
- Authoritative sources and further reading
How financial statements work in your business
The purpose of financial statements is to provide information about results of operations, financial position, and cash flows — information that managers, lenders, and investors used to make allocation decisions. That is the official framing. The practical reality for a small business owner is simpler: these documents tell you whether your business is healthy, whether it can pay its bills, and whether your strategy is working.
The four core statements
Balance sheet — a snapshot of what your business owns (assets) and owes (liabilities) at a single point in time, with the difference representing owner’s equity. Key line items to watch: current assets, accounts receivable, inventory, accounts payable, and long-term debt.

Income statement — shows revenue, cost of goods sold (COGS), gross profit, operating expenses, and net income over a period. This is your profitability report.
Statement of cash flows — reconciles net income to actual cash movement across three activities: operating, investing, and financing. A profitable company can still run out of cash; this statement is where that problem surfaces first.
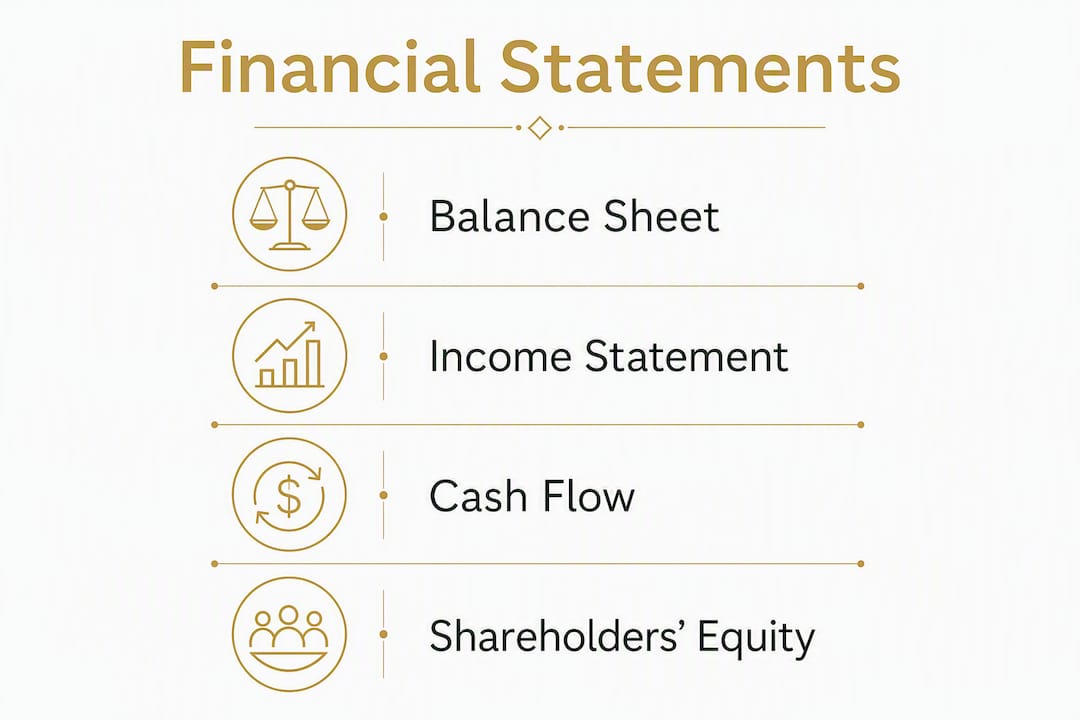
Statement of shareholders’ equity — tracks changes in ownership interests over a period, including retained earnings, dividends paid, and any new equity issued.
Recommended review cadence
| Statement | Monthly | Quarterly | Annually |
|---|---|---|---|
| Income statement | ✓ | ✓ | ✓ |
| Statement of cash flows | ✓ | ✓ | ✓ |
| Balance sheet | ✓ | ✓ | ✓ |
| Statement of shareholders’ equity | ✓ | ✓ |
Monthly income and cash flow reviews catch problems early. The balance sheet monthly gives you a running picture of working capital. Shareholders’ equity is most meaningful quarterly and at year-end, when retained earnings and distributions are clearer.
How managers actually use financial statements day-to-day
Financial statements serve internal management purposes — checking expense reasonableness, negotiating creditor terms, and giving objective metrics to guide pivots or cost cuts. Here is how that plays out in practice:
- Preparing for investor conversations — Investors want to see trend data across at least two to three periods. A clean set of statements with a short management discussion explaining results builds credibility and shortens due diligence. The SEC notes that management discussion and analysis is management’s opportunity to explain trends and uncertainties behind the numbers.
For a deeper look at reading each statement line by line, Kelliworks has a practical guide on how to read financial statements for small business.
How to analyze financial statements: techniques and ratios that matter
Professional financial analysis uses three standard techniques: horizontal (trend) analysis, vertical (common-size) analysis, and ratio analysis. Each answers a different question.

Horizontal analysis compares the same line item across multiple periods. It answers: is this number getting better or worse over time?
Worked example: Revenue was $400,000 in Year 1 and $460,000 in Year 2. That is a 15% increase. COGS grew from $240,000 to $295,000, a 23% increase. Gross profit grew in dollars but shrank as a percentage — a warning sign worth investigating.
Vertical (common-size) analysis expresses every line item as a percentage of a base figure (usually revenue for the income statement, or total assets for the balance sheet). This removes size bias and makes it easy to compare your cost structure to industry benchmarks or prior periods.
Worked example: If COGS is $295,000 on $460,000 revenue, COGS is 64.1% of revenue. If your industry average is 55%, you have a cost problem to address.
Ratio analysis converts statement data into metrics that answer specific performance questions. The CFA Institute identifies four major ratio categories: liquidity, profitability, leverage, and efficiency.
| Category | Ratio | Formula | What it tells you |
|---|---|---|---|
| Liquidity | Current ratio | Current assets ÷ Current liabilities | Can you cover short-term obligations? |
| Liquidity | Quick ratio | (Cash + Receivables) ÷ Current liabilities | Liquidity without relying on inventory |
| Profitability | Gross margin | Gross profit ÷ Revenue | Pricing and production efficiency |
| Profitability | Net margin | Net income ÷ Revenue | Overall bottom-line efficiency |
| Profitability | ROE | Net income ÷ Shareholders’ equity | Return on owner investment |
| Leverage | Debt-to-equity | Total debt ÷ Shareholders’ equity | Financial risk and borrowing capacity |
| Leverage | Interest coverage | EBIT ÷ Interest expense | Ability to service debt |
| Efficiency | Inventory turnover | COGS ÷ Average inventory | How fast inventory sells |
| Efficiency | A/R days (DSO) | (Receivables ÷ Revenue) × days | How long customers take to pay |
Pro Tip: Package five to seven of these ratios into a single one-page monthly dashboard. Include a short cash forecast alongside the ratios and a variance-to-budget highlight. That one page gives leadership everything needed for a 30-minute finance review without digging through full statements.
Reading the statements together: what the combined signals mean
No single statement tells the whole story. The real insight comes from the relationships across statements — particularly how working capital swings drive cash outcomes despite apparent profitability.
Three scenarios managers encounter regularly:
Profitable but cash-poor. Net income is positive, but operating cash flow is negative or near zero. Check the balance sheet: are receivables growing? Is inventory building up? Both absorb cash without appearing on the income statement as an expense. The fix is usually tightening payment terms or reducing inventory reorder points.
Rising receivables with flat revenue. A/R days climbing from 35 to 55 days while revenue stays flat means customers are paying slower. That cash is sitting in receivables instead of your bank account. Short-term response: send statements earlier, offer early-payment discounts, or enforce late fees. Strategically, it may signal customer financial stress worth monitoring.
Strong revenue growth with deteriorating margins. Revenue is up 20%, but gross margin dropped from 42% to 36%. Growth is masking a cost problem. The income statement shows the margin compression; the balance sheet may show higher inventory or payables, suggesting the business is buying more to support growth without pricing discipline.
Financial statements are grounded in historical data and do not predict future performance on their own. Trend analysis and scenario modeling let you infer likely patterns — but pair statements with a rolling cash forecast to stay ahead of problems rather than reacting to them. Kelliworks’s guide on identifying financial gaps in your business walks through this process in detail.
Your monthly and quarterly financial review checklist
A consistent review rhythm is what separates businesses that catch problems early from those that discover them at year-end. Here is a reproducible checklist and a short meeting agenda.
Monthly checklist
- Reconcile all bank and credit card accounts to your bookkeeping records.
- Update your 13-week cash flow forecast.
- Review three priority ratios: current ratio, gross margin, and A/R days.
- Check A/R aging — flag any invoice over 45 days for follow-up.
- Compare actual revenue and major expense categories to budget; note variances above 10%.
- Confirm payroll, tax deposits, and vendor payments are current.
Quarterly checklist
- Review balance sheet health: working capital trend, debt levels, and equity changes.
- Update your annual forecast based on year-to-date actuals.
- Evaluate capital needs for the next two quarters.
- Review any debt covenants and confirm compliance.
- Assess your tax position and adjust estimated payments if needed.
- Review the statement of shareholders’ equity for any distributions or equity changes.
30–45 minute finance review agenda
| Time | Agenda item |
|---|---|
| a few minutes | Cash position and 30-day forecast |
| 5–15 min | Income statement: revenue vs. budget, gross margin trend |
| around 15 minutes | Three key ratios: current ratio, A/R days, net margin |
| about 25 minutes | Open issues: overdue receivables, large variances, upcoming obligations |
| 35–45 min | Decisions and action items with owners |
Common mistakes and red flags to watch for
Most financial reporting problems are not fraud — they are habits that quietly distort the picture managers rely on.
Relying on profit alone. Net income is not cash. A business showing $80,000 in net income can still miss payroll if receivables are slow and payables are due. Always pair the income statement with the cash flow statement.
Mixing personal and business transactions. Personal expenses run through the business account inflate costs and understate profit. They also create tax exposure and make financial statements unreliable for any external use.
Late reconciliations. Books that are two or three months behind mean your statements reflect the past, not the present. Decisions made on stale data are decisions made blind.
Ignoring the cash conversion cycle. The gap between paying suppliers and collecting from customers is where many small businesses quietly run out of cash. Track it monthly.
Red flags to check immediately:
- Negative operating cash flow for two or more consecutive months
- A/R days rising more than 10 days above your baseline
- Inventory building without a corresponding increase in sales orders
- Frequent “one-time” adjustments or reclassifications in the same accounts
- Balance sheet values that differ significantly from market value — a reminder that historical cost accounting can obscure real asset worth
When you spot any of these, the first step is to pull the underlying transactions, not just the summary totals. A pattern in the detail usually explains the anomaly in the summary.
When to bring in an accountant or financial consultant
Some situations call for more than a monthly review. Knowing when to engage a professional — and what to ask for — saves time and prevents costly mistakes.
Engagement triggers:
- Repeated cash shortfalls despite reported profitability
- Tax complexity: multi-state filing, payroll tax issues, or entity restructuring
- Scaling beyond your current bookkeeping system’s capacity
- Preparing for a bank loan, investor round, or business sale
- Audit readiness or compliance requirements from a lender or partner
If you are unsure whether you need a consultant or a bookkeeper, Kelliworks has a clear breakdown in their guide on financial consulting vs. bookkeeping. The short answer: bookkeeping keeps records accurate; consulting interprets them and advises on decisions.
Questions to ask a prospective accountant:
- What is your standard reporting cadence, and what deliverables will I receive each month?
- Can you set up a ratio dashboard tailored to my industry?
- Will I have direct access to my bookkeeping records at all times?
- What does your onboarding process look like, and what do you need from me in the first 30 days?
- How do you handle tax planning alongside monthly reporting?
Minimum deliverables to request:
- A clean, reconciled trial balance each month
- Month-over-month cash flow forecast (rolling 13 weeks)
- A dashboard with five to seven ratios relevant to your business type
- A short written action plan after each quarterly review
For a full prep checklist before your first consulting meeting, see Kelliworks’s guide to preparing for a financial consulting meeting.
Key Takeaways
Financial statements are operational tools, not just compliance records: managers who review all four statements monthly and track five to seven ratios consistently will catch cash problems, margin compression, and growth risks before they become crises.
| Point | Details |
|---|---|
| Four statements, one picture | Balance sheet, income statement, cash flow statement, and shareholders’ equity each reveal a different dimension of business health. |
| Cash and profit differ | A profitable business can still run short on cash; always pair the income statement with the cash flow statement. |
| Three analysis techniques | Horizontal, vertical, and ratio analysis each answer a different question; use all three for a complete view. |
| Statements have limits | Historical cost accounting means balance sheet values often differ from market value; supplement statements with a rolling cash forecast. |
| Kelliworks delivers the dashboard | Kelliworks builds monthly financial dashboards, cash forecasts, and ratio reports so managers get the full picture without doing it themselves. |
What most managers get wrong about financial statements
The conventional wisdom says financial statements are primarily for accountants and investors. That framing leads managers to treat them as a quarterly obligation rather than a weekly tool — and that gap is where most small business cash crises quietly begin.
The more useful frame is this: financial statements are the only objective record of what your business actually did, as opposed to what you planned or hoped. Every pricing decision, every hiring choice, every vendor negotiation leaves a trace in these documents. Managers who read them regularly develop an instinct for their business that no dashboard metric alone can replicate.
There is one nuance worth naming directly. Statements are backward-looking by design. They tell you what happened, not what will happen. The managers who use them most effectively pair historical statement analysis with a forward-looking cash forecast — usually a 13-week rolling model — so they are always working with both a rearview mirror and a windshield. That combination, not the statements alone, is what keeps a business financially stable through growth and uncertainty.
Kelliworks: your virtual accounting department for financial clarity
Running a business is demanding enough without spending hours each month decoding financial statements on your own. Kelliworks functions as a full-service virtual accounting department for small businesses — handling bookkeeping, monthly financial reporting, cash forecasting, and ratio dashboards so you always know where your business stands.
The difference from a traditional firm is in the delivery. Kelliworks clients receive a monthly one-page financial summary with key ratios, a cash forecast, and a variance-to-budget highlight — the exact package described in this guide — without building it themselves. Onboarding typically takes 30–60 days: we reconcile your existing books, set up your chart of accounts, and deliver your first clean monthly report within the first billing cycle. From there, you get consistent, timely statements you can actually use for decisions, credit applications, and growth planning. To get started, schedule a consultation and see what a managed accounting relationship looks like for your business.
Authoritative sources and further reading
Vetted resources for managers who want to go deeper on financial statement analysis and reporting:
- SEC Beginner’s Guide to Financial Statements — the clearest official definitions of all four statements; best starting point for anyone new to business financial reporting.
- CFA Institute: Financial Analysis Techniques — authoritative coverage of ratio analysis, common-size statements, and forecasting methods used by professional analysts.
- Investopedia: Financial Statement Analysis — accessible explanations of horizontal, vertical, and ratio analysis with practical examples.
- OpenStax: Principles of Finance — free, peer-reviewed textbook chapter framing financial statements as leadership and stewardship tools.
- Vivos Financial Accounting and Reporting Services — useful reference for businesses exploring outsourced accounting and reporting models.
- Kelliworks: How to Read Financial Statements for Small Business — practical, line-by-line reading guide built for small business owners, with templates adaptable to both cash and accrual accounting methods.
A note on templates: any template you adopt should be reviewed against your specific industry and accounting method. A retail business tracking inventory turnover needs different defaults than a service firm tracking billable utilization. Cash-basis and accrual-basis businesses also produce materially different income statements, so confirm which method your statements use before benchmarking against industry data.