


Your bookkeeping records already contain a growth plan. You just need to know where to look. The most direct path is to focus on three core signals: gross profit margin, operating cash flow, and percent-of-revenue category metrics. Together, they tell you whether your business can actually afford to grow, and where the money is quietly leaking.
Start here, in the next 48 hours:
- Pull your last 12 months of profit and loss statements from QuickBooks, Xero, or your accounting software.
- Calculate your gross profit margin (revenue minus cost of goods sold, divided by revenue) and your operating cash flow for the same period.
- Pick one target metric to improve this quarter, whether that is gross margin, days sales outstanding, or payroll as a percentage of revenue.
If those numbers are unclear or your books need cleanup first, that is exactly where a virtual accounting partner adds immediate value. You can also download the Kelliworks 2026 Financial Consulting Checklist to guide your first self-audit.
Pro Tip: You do not need perfect books to begin. Even a rough 12-month P&L with consistent categorization reveals patterns that drive real decisions.

Table of Contents
- Which financial metrics should you prioritize first?
- What reports do you need to pull right now?
- How do you turn financial data into a growth plan?
- What does outsourcing this work cost, and how long does it take?
- How do you choose the right outsourced accounting partner?
- What results do clients typically see?
- Your 30-to-90-day implementation checklist
- Key Takeaways
- The value of turning your numbers into decisions
- How Kelliworks turns your bookkeeping into a growth plan
- Useful sources and further reading
Which financial metrics should you prioritize first?
Gross profit margin, operating cash flow, and revenue form the starting triad for any small business. Once you have those three stable and visible, you add unit economics and category-level ratios.
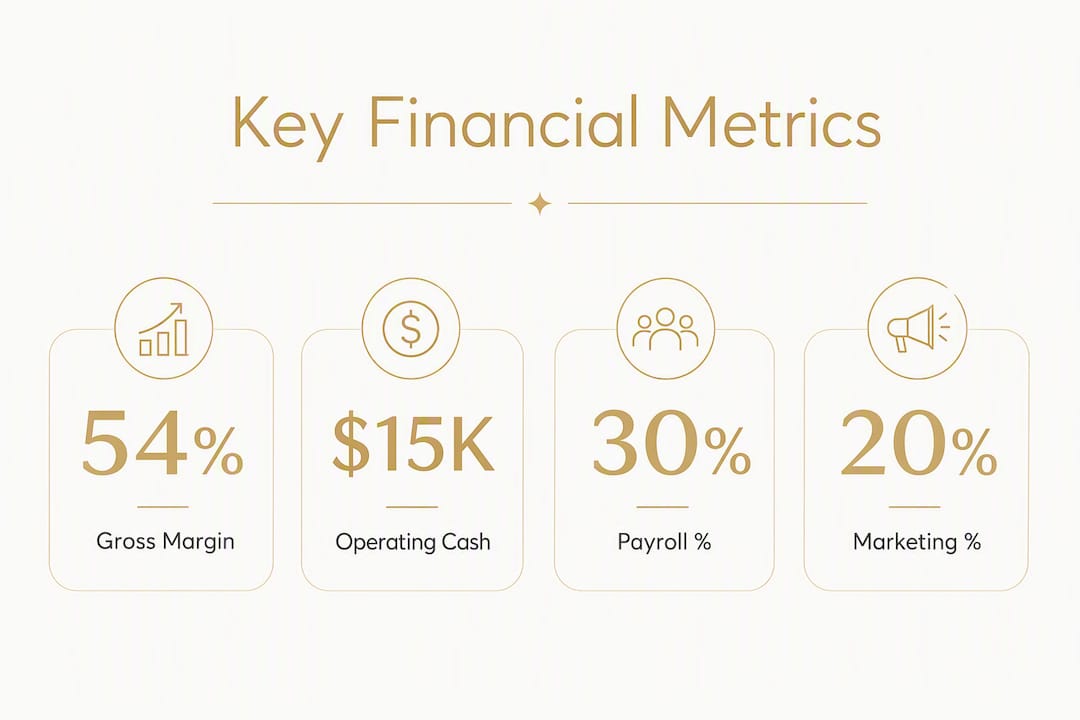
Here is how to calculate each one:
| Metric | Formula | Why It Matters |
|---|---|---|
| Gross Profit Margin | (Revenue – COGS) ÷ Revenue | Shows whether your core product or service is profitable before overhead |
| Operating Cash Flow | Net income + non-cash items ± working capital changes | Reveals actual cash generated from operations, not just accounting profit |
| COGS % of Revenue | COGS ÷ Revenue | Flags rising input costs before they compress margin |
| Payroll % of Revenue | Total payroll ÷ Revenue | Signals overstaffing or under-pricing relative to labor cost |
| Marketing % of Revenue | Marketing spend ÷ Revenue | Benchmarks acquisition cost against revenue capacity |
Revenue alone tells you almost nothing useful. A business can grow revenue significantly while its gross margin collapses, leaving less cash than the year before. Percent-of-revenue views catch that structural drift months before it shows up as a cash crisis.
For monitoring cadence, check operating cash flow weekly, review margins monthly, and run a full unit-economics review quarterly. Service businesses should also track cash reserves: a buffer of several weeks of operating expenses is recommended, but many firms carry far less.
Pro Tip: Express every major expense line as a percentage of revenue, not just a dollar amount. A payroll cost that looks stable in dollars may be quietly growing as a share of revenue, which is the early warning sign that matters.
What reports do you need to pull right now?
Before any analysis can happen, you need clean, complete data. Here is the standard pull list:
- Monthly P&L for the last 12 months
- Cash-flow statement (same period)
- Balance sheet (current and prior year-end)
- AR and AP aging reports
- Sales by product or service line
- Payroll summary by month
- Customer acquisition cost data from your CRM or ad platforms
Once you have those, express the major cost categories as a percentage of revenue by month. Here is a simplified example of what that table looks like:
| Month | Revenue | COGS % | Payroll % | Marketing % | Gross Margin % |
|---|---|---|---|---|---|
| January | — | — | — | 6% | — |
| February | — | — | 30% | 7% | — |
| March | — | — | — | 5% | — |
That format immediately shows whether February’s margin dip came from higher COGS or a payroll spike. Raw dollar columns would hide that entirely.
Good bookkeeping practices are the foundation here. The most common data-quality problems to fix before analysis: incorrect account mapping (personal expenses coded to COGS), unrecorded deposits, inconsistent revenue recognition across months, and bank feeds that are weeks behind. Fix these first, or your analysis will produce confident conclusions from bad inputs.
A critical point many owners miss: cash in the bank is not the same as spendable cash. A large client deposit for future work is a liability until that work is delivered. Your AR and AP aging reports adjust the picture significantly.
How do you turn financial data into a growth plan?
A five-step process converts raw bookkeeping data into a plan your team can act on. An outsourced accounting partner can run steps 1 through 4 and hand you a ready-to-execute plan within four to eight weeks.
- Clean the data (outsourced team): Reconcile accounts, fix mapping errors, and standardize revenue recognition across all 12 months.
- Set targets (business owner + advisor): Choose one to three metrics to move this quarter. Be specific: “Increase gross margin from 54% to 58%” beats “improve profitability.”
- Diagnose gaps (outsourced team): Compare your percent-of-revenue ratios against prior periods and industry benchmarks. Identify the two or three line items with the most variance.
- Model scenarios (outsourced team): Build a three-statement financial model that links your income statement, balance sheet, and cash flow. Run at least a base case and a downside scenario.
- Act and monitor (business owner + advisor): Implement one change, measure it for one full operating cycle, then move to the next.
Here is a compact before/after example showing two common levers:
| Scenario | Change | Cash Impact (Monthly) | Gross Margin Impact |
|---|---|---|---|
| Baseline | No change | — | 54% |
| Price increase | +2% on all services | +$1,600 on $80K revenue | +2 pts |
| DSO reduction | Collect 10 days faster | +$2,200 freed from AR | No direct margin change |
Pro Tip: Implement one high-impact change first and measure it for a full operating cycle before adding another. Stacking multiple changes at once makes it impossible to know what actually worked.
What does outsourcing this work cost, and how long does it take?
A realistic timeline for a virtual accounting partner to deliver a growth plan looks like this:
- Week 1: Data gathering, account reconciliation, and data-quality fixes
- Weeks 2–3: Percent-of-revenue analysis, KPI dashboard build, and scenario modeling
- Week 4: Deliver the growth plan, dashboard, and three-statement model
- Months 2–3: Implementation support, monthly review calls, and monitoring
Pricing varies by scope. A project-based engagement covering data cleanup, a KPI dashboard, and a three-statement model typically falls in a low-to-mid range for a straightforward service business with clean books. Add historical cleanup, inventory complexity, or payroll reconciliation and the scope, and cost, rises accordingly. Ongoing monthly monitoring support is usually structured as a recurring retainer on top of the initial project fee.
What you should expect at each level:
-
Entry scope: Data categorization, core KPI report, one scenario model
-
Mid scope: Full three-statement model, KPI dashboard, two scenario runs, one monthly review call
-
Full scope: Everything above plus historical cleanup, AR/AP optimization recommendations, and quarterly CFO-level reviews
A 30-minute monthly review on a fixed calendar date is the minimum cadence to catch deterioration early. Build that into any engagement from the start.
How do you choose the right outsourced accounting partner?
Lead with this filter: prioritize partners who offer three-statement modeling, percent-of-revenue reporting, and ongoing implementation support. A partner who only delivers a monthly P&L is a bookkeeper, not a growth advisor.
Questions to ask in discovery:
- Do you have experience with businesses in my industry and at my revenue stage?
- Can you show me a sample KPI dashboard or anonymized deliverable?
- How do you handle data security and QuickBooks integration?
- What is your review cadence, and who is my point of contact?
- How do you define success for an engagement like mine?
Trust signals worth looking for: anonymized client results, published resources like the Kelliworks 2026 consulting checklist, and clear documentation of what is included in each engagement tier. If a partner cannot show you a sample deliverable, that tells you something.
Kelliworks structures the first 60–90 days around data cleanup, KPI dashboard setup, and a base-case growth model. By day 90, clients have a working dashboard, a tested scenario model, and a clear set of targets for the next quarter. If you are unsure whether you need a bookkeeper or a financial consultant, the comparison guide on the Kelliworks site walks through the distinction clearly.
Pro Tip: Ask any prospective partner to walk you through how they would handle a specific scenario in your business, such as a 15% revenue drop or a new hire decision. Their answer reveals whether they model or just report.
What results do clients typically see?
Owners who move from passive bookkeeping to active financial analysis consistently report a few categories of improvement. Shorter days sales outstanding frees cash without requiring new revenue. Gross margin improvements, often from a single pricing adjustment or the elimination of one low-margin service, show up within one to two quarters. Clearer visibility into payroll as a percentage of revenue gives owners the confidence to make hiring decisions without guessing.
Qualitative outcomes matter too. Clients frequently describe the shift from reactive to proactive as the most valuable change: fewer surprise tax bills because they are reserving 25–35% of net profit monthly into a separate tax account, and clearer answers to the question “Can we afford this?” before committing.
The Kelliworks personalized financial strategies resource and the 2026 consulting checklist are worth reviewing during discovery. They outline the specific deliverables and milestones clients can expect, and they give you a framework for evaluating whether any partner’s approach matches your needs.
Your 30-to-90-day implementation checklist
First 30 days
- Export 12 months of P&L, cash-flow statement, and balance sheet from your accounting software.
- Fix account mapping errors and reconcile all bank feeds.
- Calculate gross profit margin, operating cash flow, and payroll % of revenue for each month.
- Build a percent-of-revenue table covering COGS, payroll, and marketing.
- Set one primary target metric with a specific numeric goal.
Days 31–90
- Build or commission a three-statement model with a base case and one downside scenario.
- Set a fixed monthly review date (30 minutes minimum).
- Implement one quick-win change and measure it for a full operating cycle.
KPI dashboard template items to track:
- Gross profit margin (monthly, alert if it drops more than 2 points month-over-month)
- Operating cash flow (monthly, alert if negative two months in a row)
- DSO (monthly, target under 30 days for most service businesses)
- Payroll % of revenue (monthly, flag if it exceeds your industry benchmark)
- Cash runway in weeks (weekly, alert below 8 weeks)
Three quick wins to pursue first:
- Shorten DSO by tightening invoice terms and following up on overdue accounts at day 15, not day 30.
- Adjust pricing on your highest-volume service by 2–3% and model the margin impact before rolling it out broadly.
- Identify and exit one low-margin offering that consumes disproportionate time or COGS.
For a structured starting point, the business financial goals guide on the Kelliworks site provides concrete target examples you can adapt immediately.
Key Takeaways
Tracking gross profit margin, operating cash flow, and percent-of-revenue category metrics gives small business owners the three signals they need to build a repeatable, data-driven growth plan.
| Point | Details |
|---|---|
| Start with three metrics | Gross profit margin, operating cash flow, and percent-of-revenue ratios reveal more than revenue alone. |
| Fix data quality first | Incorrect account mapping and unrecorded deposits corrupt analysis before it starts. |
| Use a five-step process | Clean, target, diagnose, model, and act — an outsourced partner can deliver this in 4–8 weeks. |
| Reserve for taxes monthly | Setting aside 25–35% of net profit each month — 30% is a practical starting point — prevents year-end surprises and improves cash planning. |
| Kelliworks as your partner | Kelliworks structures the first 60–90 days around data cleanup, a KPI dashboard, and a tested growth model. |
The value of turning your numbers into decisions
Most owners I work with are not short on ambition. They are short on clarity. The books exist, the transactions are there, but no one has organized them into a picture that answers the questions that actually keep you up at night: Can I afford to hire? Should I raise prices? Am I growing or just getting busier?
You do not need perfect books to start. You need enough data to see the pattern, and then the discipline to act on one thing at a time. The owners who make the most progress are rarely the ones with the most sophisticated models. They are the ones who commit to a monthly review, pick one metric to move, and follow through.
How Kelliworks turns your bookkeeping into a growth plan
Your financial records are already generating data. Kelliworks converts that data into a working growth plan, so you spend your time running the business instead of decoding spreadsheets.
As your virtual accounting department, Kelliworks handles the full process: data cleanup and reconciliation, KPI dashboard setup, three-statement scenario modeling, and monthly CFO-level review calls. You get a clear deliverable at the end of week four and ongoing support through implementation. No long onboarding, no vague retainers, and no hand-off to a junior associate after the first meeting.
Services included in a typical engagement:
- Bookkeeping cleanup and account reconciliation
- Percent-of-revenue KPI dashboard
- Three-statement financial model (base case + downside)
- Monthly review calls with implementation tracking
- Tax reserve planning and tax preparation support
Ready to see what your numbers are actually telling you? Schedule a discovery call with Kelliworks and walk away with a clear first step, at no cost.
Useful sources and further reading
- Kelliworks Financial Consulting Checklist for Startups: 2026 Guide — the publisher’s step-by-step checklist for structuring a financial consulting engagement
- Kelliworks: How to Create a Financial Growth Strategy for Small Business — a companion guide to the five-step process covered here
- Small Business KPIs: What Are the Numbers That Matter? — the US Chamber of Commerce’s guide to choosing metrics by business stage and model



One Response